

Introduction
Data analytics is no longer optional for tech companies, it’s essential. The right analytics tools allow businesses to uncover actionable insights from massive data streams, optimize products, and make informed decisions faster than competitors. For tech teams, understanding user behavior, operational efficiency, and market trends can translate directly into revenue growth and innovation. Choosing the right data analytics platform means your company can visualize complex datasets, detect patterns, and generate predictive insights that guide strategy while ensuring that every team member, from developers to executives, can access meaningful information effectively.
What to Look for in Data Analytics Tools (Before You Choose)
When selecting a data analytics tool, tech companies should evaluate multiple factors. Scalability ensures your platform can handle growing data volumes, while real-time analytics lets teams react to emerging trends instantly. Integration capabilities matter, especially for connecting with cloud services, databases, or other SaaS products. Usability is critical, as complex tools can slow adoption. Pricing also plays a role, with costs varying widely depending on features and team size. By understanding these criteria in advance, companies can choose a solution that supports current needs and future growth without sacrificing efficiency or insight quality.
5 Best Data Analytics Tools for Tech Businesses
Best Tool #1: Microsoft Power BI
Microsoft Power BI is a top choice for tech companies seeking powerful analytics paired with a familiar Microsoft environment. Its interactive dashboards and robust reporting features allow teams to visualize data effectively. Power BI seamlessly integrates with Azure, Excel, and other Microsoft services, simplifying workflows and centralizing information. It supports real-time data connections and offers AI-powered insights, making predictive modeling easier for technical teams. Whether monitoring KPIs, analyzing customer behavior, or driving strategic planning, Power BI provides an accessible, scalable solution that balances advanced features with a user-friendly design for cross-functional teams.
Best Tool #2: Tableau
Tableau excels in turning complex data into intuitive, interactive visualizations. Its drag-and-drop interface makes it accessible for both analysts and non-technical users. Tech companies benefit from its real-time dashboards, advanced analytics capabilities, and seamless collaboration features, allowing teams to share insights instantly. Tableau also supports integration with multiple databases and cloud platforms, offering flexibility in data handling. Ideal for product development, user experience analysis, or operational monitoring, Tableau empowers teams to make faster, data-driven decisions. Its rich visual storytelling helps stakeholders understand insights clearly, supporting smarter, faster strategic moves.
Best Tool #3: Zoho Analytics
Zoho Analytics is a versatile platform designed for companies seeking simplicity without sacrificing power. It offers AI-driven analytics, automated reporting, and cross-departmental insights, helping tech teams make data actionable across marketing, product, and operations. Its intuitive interface reduces the learning curve, while integrations with popular apps and cloud databases streamline workflows. Zoho Analytics is particularly effective for small to mid-sized tech companies looking to centralize data insights and drive collaboration. With predictive analytics and custom dashboards, teams can forecast trends, monitor performance, and uncover hidden patterns that inform both strategic planning and day-to-day decisions.
👉 You might also like: 5 Best Developer Tools from Microsoft Tools You Should Use
Best Tool #4: Google Looker (Looker Studio)
Google Looker is built for companies that need deep data exploration and modeling. Using LookML, tech teams can create custom data models that adapt to complex workflows and support advanced analytics. Looker integrates seamlessly with BigQuery and other Google Cloud tools, making it ideal for cloud-native tech stacks. Teams can generate real-time dashboards, explore granular datasets, and share insights across departments. Looker’s flexible API and visualization options allow engineers and analysts to collaborate effectively, ensuring decision-makers have access to actionable insights without getting lost in raw data or technical complexity.
Best Tool #5: ThoughtSpot or SAS Viya
ThoughtSpot offers self-service analytics with a search-driven interface, allowing users to ask questions in plain English and get instant insights. It’s perfect for teams that want fast, interactive data discovery without heavy technical setup. On the other hand, SAS Viya is an enterprise-grade platform that focuses on predictive analytics, machine learning, and AI-powered decision support. Both tools cater to advanced analytics needs, helping tech companies uncover patterns, forecast trends, and improve operational efficiency. Choosing between them depends on whether you need simplicity with search or comprehensive AI-driven analytics for complex datasets.
Comparison Table
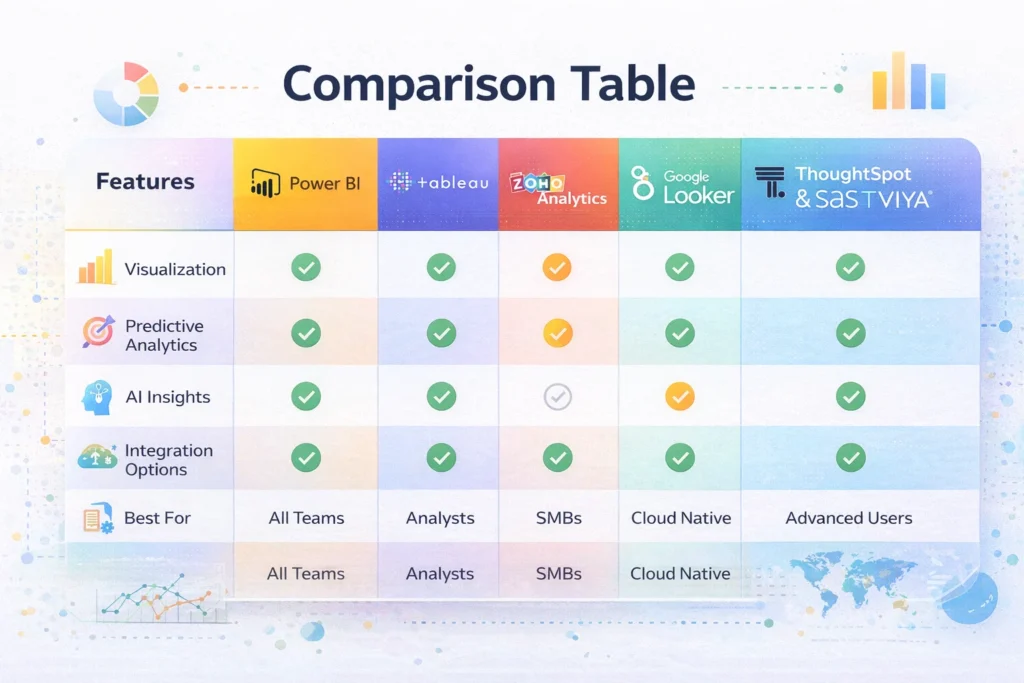
Here’s a side-by-side snapshot of the top five analytics tools for tech companies. Power BI and Tableau excel in visualization and collaboration, while Zoho Analytics balances simplicity and automation. Looker is ideal for cloud-native data modeling, and ThoughtSpot or SAS Viya provides advanced predictive capabilities. Pricing varies from subscription-based plans to enterprise licenses. Each tool has strengths depending on team size, technical expertise, and data complexity. Reviewing features, integration options, and real-world use cases side by side helps companies choose a solution that fits their current needs while leaving room for future growth.
How Tech Companies Apply These Tools
Tech companies use analytics tools across every part of their operations. Product teams analyze user behavior to improve features, while marketing leverages insights to optimize campaigns. Operations and finance teams monitor KPIs in real time, allowing quick decisions that reduce risk. Advanced analytics also enable predictive modeling, helping companies forecast trends or detect anomalies before they impact performance. By centralizing data and automating reports, teams can focus on strategic insights rather than manual calculations, turning raw data into actionable intelligence that drives growth, efficiency, and innovation across the organization.
Tips for Implementation in Tech Teams
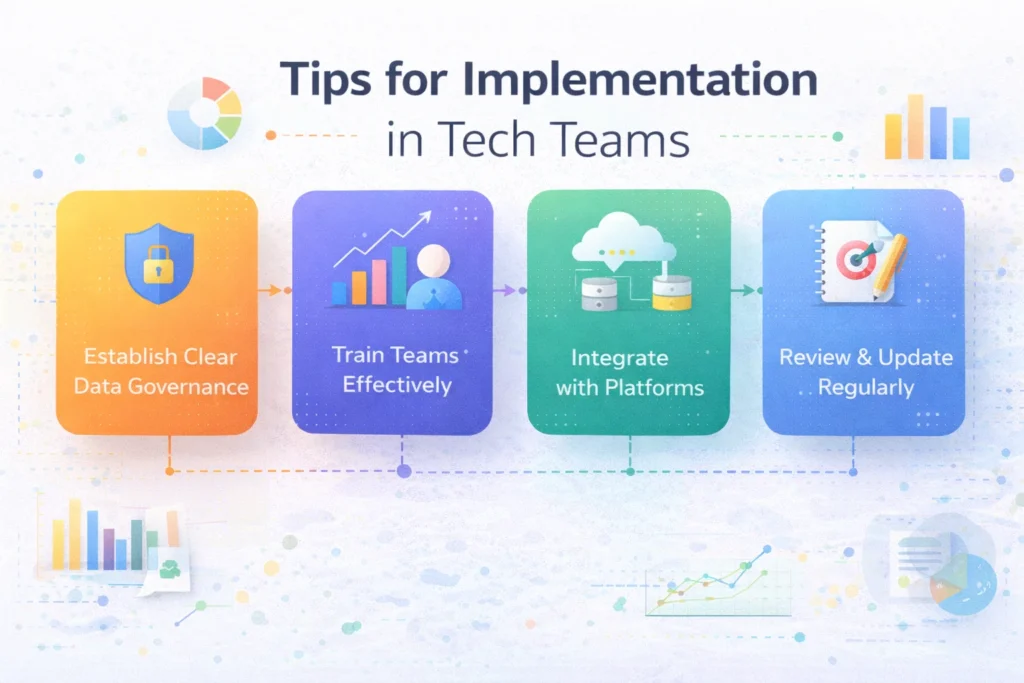
Successfully adopting analytics tools requires careful planning. Establish clear data governance to maintain accuracy and security, and ensure teams receive proper training on the tool’s features. Integration with existing databases and cloud platforms is key to seamless workflows. Start with pilot projects to validate insights and avoid overwhelming staff. Encourage collaboration between analysts, engineers, and decision-makers so dashboards and reports reflect real business needs. Regularly review performance and update data models, ensuring the tool continues to deliver value. Following these steps helps tech companies maximize ROI and accelerate data-driven decision-making without common pitfalls.
Future Trends in Data Analytics Tools
Data analytics is evolving rapidly, with AI and automation leading the way. Modern platforms are embedding machine learning directly into dashboards, allowing teams to forecast trends and detect anomalies automatically. Real-time analytics is becoming the norm, giving tech companies the ability to respond instantly to user behavior or operational shifts. Embedded analytics allows insights to flow into existing apps, while augmented analytics uses AI to suggest patterns or actionable recommendations. Staying ahead means choosing tools that adapt to these trends, helping teams turn complex datasets into strategic, forward-looking insights with minimal manual effort.
Conclusion
Choosing the right data analytics tool depends on your company’s size, data maturity, and business goals. Small teams may prioritize simplicity and cost-efficiency, while larger enterprises often require predictive analytics and advanced integration options. Testing tools through free trials or pilot projects helps evaluate usability, functionality, and ROI before making long-term commitments. By selecting a solution aligned with team workflows and growth plans, tech companies can unlock actionable insights, improve decision-making, and gain a competitive edge. The right tool doesn’t just analyze data it empowers teams to act on it confidently.
Frequently Asked Questions (FAQs)
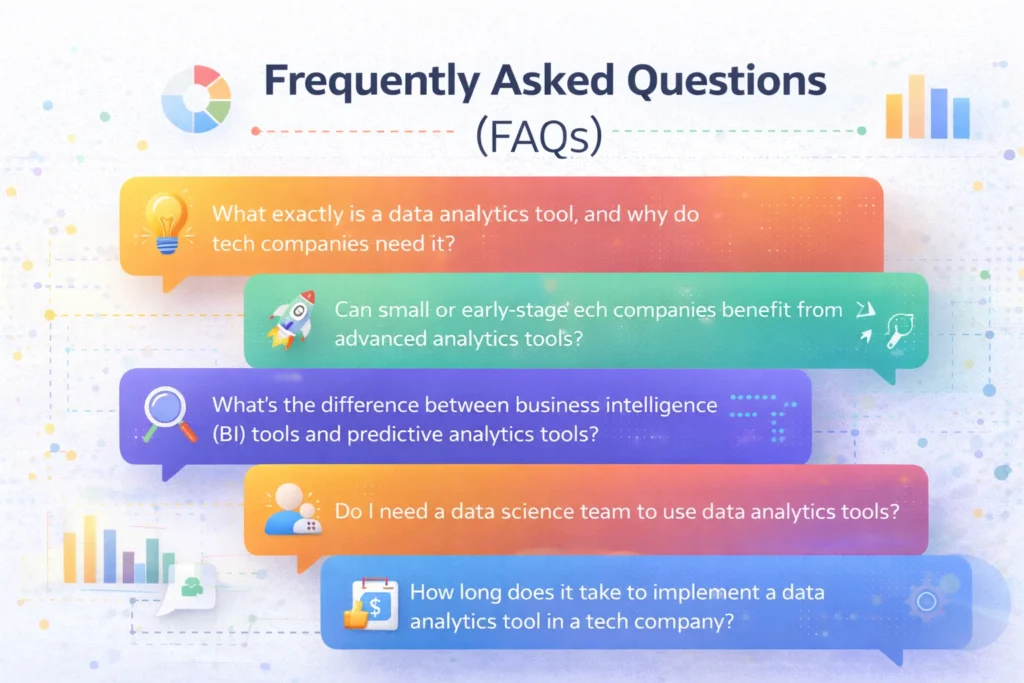
What exactly is a data analytics tool, and why do tech companies need it?
A data analytics tool helps you collect, process, and visualize data so you can understand patterns and trends. For tech companies, these tools turn raw numbers into insights that guide product decisions, marketing strategy, and operational improvements. They automate heavy analysis tasks and give teams the confidence to act on real data instead of guesswork.
Can small or early‑stage tech companies benefit from advanced analytics tools?
Absolutely. Even small teams can use basic analytics features like dashboards and reporting to gain insights into customer behavior and product performance. Many tools offer free plans or scalable pricing, which lets startups experiment with analytics before investing heavily. Starting early builds a strong data culture that supports long‑term growth.
What’s the difference between business intelligence (BI) tools and predictive analytics tools?
BI tools focus on reporting, dashboards, and summarizing what has already happened, which is great for real‑time visibility. Predictive analytics tools go further by using statistical models and machine learning to forecast future trends and suggest actions. Tech teams often use both types together to understand the present and plan for the future.
Do I need a data science team to use data analytics tools?
Not always. Many modern analytics platforms are designed for self‑service, letting non‑technical users explore data and generate reports without deep expertise. That said, having even one analyst or someone with data literacy helps ensure the right questions are asked and insights are interpreted correctly.
How long does it take to implement a data analytics tool in a tech company?
Implementation can vary. Simple tools with drag‑and‑drop dashboards can be set up in a few weeks, while complex systems requiring custom data modeling and integration across platforms might take months. Planning your data infrastructure and training users early speeds up adoption and reduces bottlenecks.
Are free data analytics tools worth using over paid ones?
Free tools are useful, especially for small teams that want to get started with basic reporting and dashboards. They let you centralize data and test workflows. Paid tools usually add advanced features like AI insights, real‑time data processing, and deeper integration options that matter more as your data volume grows. Choosing the best option depends on your requirements and budget.
✨ Tech made simple, follow Milyom for more.


")


